In the fast-paced, data driven world of today, Self-Service Business Intelligence (BI) has made a significant change for organisations. It has enabled users to access and analyse their data independently and at once. This allows data teams to focus on the organisation’s data strategy and setting up a data culture with the right data being available at the right times. However, as adoption of self-service BI grows, so does the need for governance and control over data access and usage. In this article, we explore how teams can use Microsoft’s Graph and Power BI APIs to collect data and monitor their BI platforms efficiently.
Microsoft Graph is a comprehensive set of API endpoints made available by Microsoft that provides access to a wide array of data and services across various Microsoft cloud services: Microsoft 365 core, enterprise mobility & security, Windows and D365. In a similar fashion, the Power BI APIs provide endpoints to manage, administrate, and embed Power BI content. Out of these, our focus will be on Graph’s Azure Active Directory endpoints and Power BI’s workspace and object endpoints.
Laying the Foundation
The first step is ensuring access to the services outlined above. While a user account with the right access levels can be used, a more sustainable way would be creating an Azure AD application and using the app’s service principal to authenticate and automate calling the REST endpoints. The AD application will need the Directory.Read.All permissions granted to it to have the required rights to read and query Azure Active Directory.
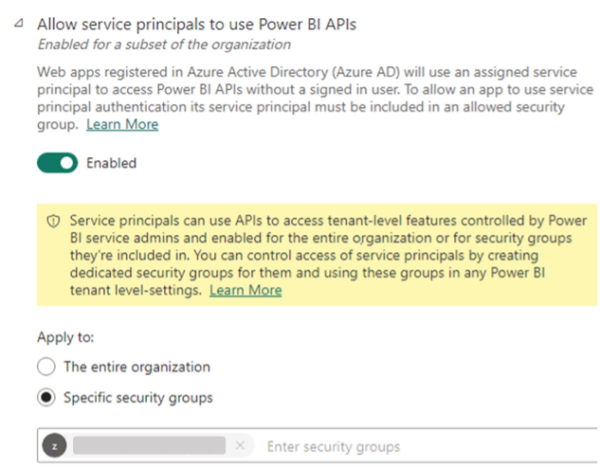
A second setting that will need to be configured is enabling service principals to use Power BI APIs on the Power BI Admin Portal. To be able to access Power BI content, the service principal will need to be added to the workspace as a member or admin. An alternative to this is to use the Admin suite of Power BI API endpoints which operates at a tenant level and does not need access to each workspace and object. However, this may or may not suit the actual needs of this exercise, so you might need to explore both options and choose the method that works best. For our use case, we focus on the non-admin endpoints since not all workspaces in a tenant will be used for Self Service.

Figure 1 Enable AD App to access Power BI content
Creating an Audit Datamart
With the groundwork set up, we are now ready to start collecting data. There are several ways of achieving this, but the general process follows these steps:
- Authenticate service principal and acquire
- GET data securely from API endpoints.
- Persist the JSON response in a data store.
- Ingest raw data into a database to transform and build the data model.
- Consume created data model.
Authenticating Services
First step would be to use the service principal we configured earlier to authenticate the Graph and Power BI services and retrieve an authentication token. This can be through a POST to Microsoft Identity Platform’s login service at:
https://login.microsoftonline.com/{tenant_id}/oauth2/v2.0/token
Snippet below shows what the data you pass to the request should look like.
{

"grant_type": "client_credentials",

"client_id": "{client_id}",

"client_secret": "{client_secret}",

"scope": "{auth_scope}"

}
Client ID and secret would be the detail you set up when configuring the service principal. The scope defines which service you are looking to get an authentication token for:
- Graph: https://graph.microsoft.com/.default
- Power BI: https://analysis.windows.net/powerbi/api/.default
This authentication token needs to be in the header of every subsequent request to download API data:
{

"Content-Type": "application/json",

"Authorization": "Bearer {auth_token}",

"ConsistencyLevel": "eventual"

}
Collect and Store Raw Data
Since the focus of this article is on governance and security, we outline the following endpoints that would best serve this use case. You can find a comprehensive list of endpoints on the official documentation pages for Power BI and Graph.
- Azure Active Directory/MS Graph:
- List users
- List AD groups
- List group members
- Power BI:
- List workspaces. For each workspace,
- List users
- List datasets
- List reports
- List workspaces. For each workspace,
-
- For each dataset,
- List users
- List data sources
- List refresh history
- List refresh schedules
- For each dataset,
- For each report,
- List users
- List applications. For each app,
- List Users
- List activity events
All of these are returned as JSON files and can be easily stored in a data lake. Timestamping the files might be a clever idea, so you always have historical snapshots. All the datasets collected above are slow changing except for Activity Events, which tracks user activity on the Power BI platform with a latency of about 30 minutes.
Build a Data Model
With the raw data downloaded and persisted, the next step would be to load this into a database and create a data model. These datasets require no transformation/cleansing, but you might want to go through them and get rid of any fields you do not need.
- Users, AD Groups, Workspaces, Reports, and Datasets are excellent candidates to set up a Type-2 Slowly Changing Dimensions.
- Group Members, Power BI users, data sources, and schedules can be set up to serve as lookup or reference tables and overwritten each time new data is available and do not have any date/time component to them.
- Refresh History API has a limit to the amount of data it returns, so you will need to set up an incremental load on the database to maintain a longer history.
- Activity Events could serve as the primary transaction table in the data model. However, this does not contain any numerical metrics in the standard sense of an EDW’s fact table.
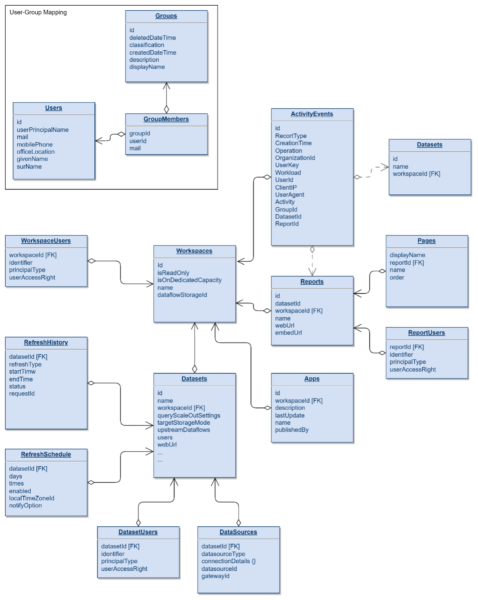
- For the model we have built, every dataset starts from a workspace and has a Primary Key – Foreign Key relationship to the Workspace master data.
- Activity Events table can be changed to have references to Workspaces, Datasets, Reports, and Applications using their IDs.

Figure 2 Sample Audit DB data model
Automating the process
There are several ways this entire process can be automated. For example, a simple lightweight audit database can be set up with an Azure SQL instance and the end-to-end process orchestrated with Azure Data Factory. Ultimately, choose a stack and services that works best for your team.

Why do I need this?
Great question. Depending on the size of your data platform and userbase, just fixing issues and helping users could eat up a lot of your time. A model including these datasets helps you easily answer questions like:
- Who has access to what workspaces/reports/datasets?
- How often do they access the content?
- Are there any long running dataset refreshes?
- Has a critical report failed to refresh?
- What organisational groups are the most active when it comes to analytics?
These could in-turn translate to decisions and benefits such as:
- Track and maintain data security and confidentiality.
- Save on licensing costs by removing infrequent users and ex-employees.
- Identify performance bottlenecks and help tune it.
- Have a centralised monitor for all your report refreshes and identify issues instantly.
- Enable and empower users – a user that can do more or a user that might need help.
- And more…!
At Adaptiv, we place a massive emphasis on data governance & democratisation and strive to promote a data culture revolving around these tenets. Through our tailored services and highly skilled experts, we will work together to help you on your data journey, no matter what stage of your data and digital transformation you are in. Reach out to us today to have a chat with one of our data professionals to learn how we can help you with your next big data initiative!


