


Monitoring the status of your Boomi runtime and processes is a critical aspect of any integration project. Not knowing if your runtime is active or if your integrations are failing can result in loss of revenue, business critical outages, and other impacts.
Out of the box, Boomi provides some limited observability capabilities. This takes the form of subscribing to the ATOM.STATUS email alerts in the user settings interface. Boomi will notify the subscriber of any downtime of the Boomi runtimes. For simple integration projects, this may suffice, but for anything more business critical (e.g. client-facing services, financial correspondence), other types of observability are required. Another more proactive approach that is relatively simple would be to monitor the shared web server health endpoint to ensure the runtime is up and the jetty web server is active.
However, to enable full observability of all aspects of the runtime, Boomi provides this article that defines “what” should be monitored but doesn’t go into the “how”. That’s where application monitoring tools like Azure Application Insights come in. Azure Application Insights is an OpenTelemetry feature of Azure Monitor that offers application performance monitoring (APM) for live web applications.
When used in conjunction with Azure Monitor for VMs, you can end up with full observability of the entire Boomi runtime, with the ability to build dashboards, run queries and send alerts.

Image 1: Example dashboard
The following is a guide to get you started monitoring Boomi with Azure Application Insights but won’t go into all the details that could be covered (maybe in a later blog post!). There are some advanced concepts here, so solid familiarity with both Boomi and Application Insights is assumed. The steps are as follows. This assumes a runtime cluster (molecule) is being used; however, it can also be done for a single runtime (atom).
Step 1: Jar File Setup
-
Download the latest application insights jar from Releases · microsoft/ApplicationInsights-Java.
-
Put this into a location that the runtime can access, usually a subfolder under the Runtime Installation Directory.
-
In Runtime Management, select the runtime, properties, then advanced.
-
Select Java Class Path from the dropdown, and Add a Property
-
Add the full path to the applicationinsights-agent-X.X.X.jar

Image 2: Java Class Path Configuration
Step 2: Configuration
A configuration file needs to be uploaded to the same place as the jar file. This file will document the application insights connection string, log levels, log file location, as well as the metrics to collect. It’s probably easier to edit this file locally then copy it over (e.g. using SCP) once done. Also see this page for other approaches to configuration.
-
Navigate to your application insights instance, and copy the InstrumentationKey
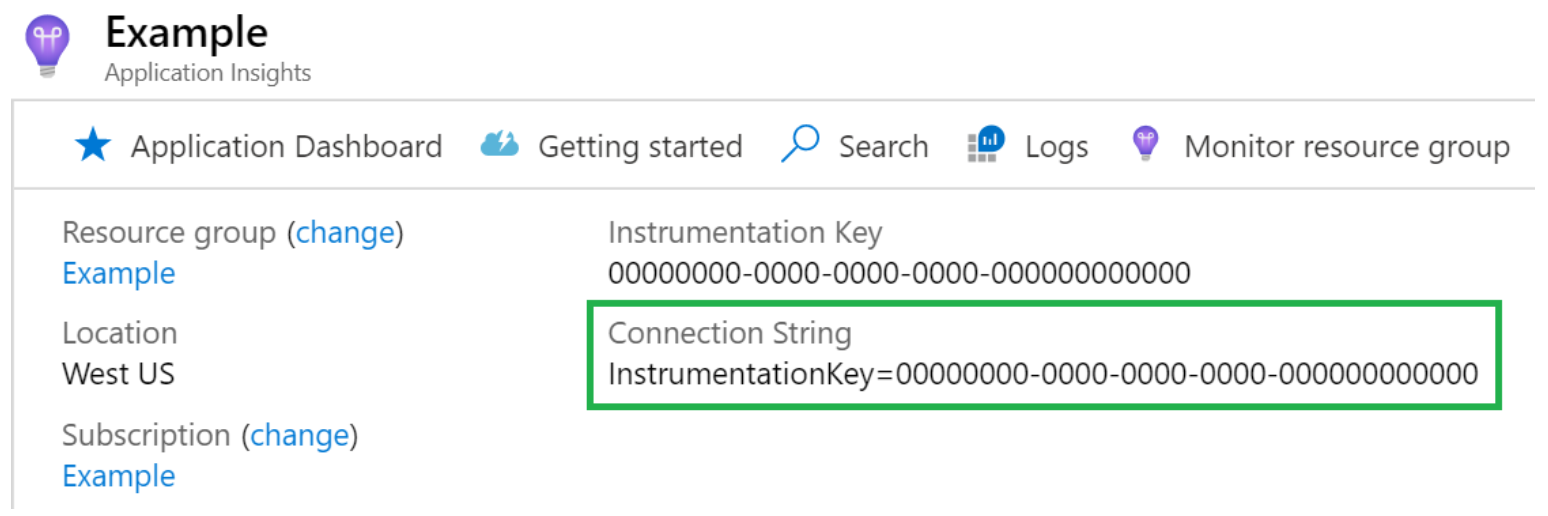
Image 3: App Insights Connection String location
-
Add Connection String value to the connectionString key in the json
{ "connectionString": "CONNECTIONSTRING", -
The selfdiagnostics section can largely be left as is, unless you want to change log file path, log level for app insights itself, if it logs to the console, etc.
"selfDiagnostics": { "destination": "file+console", "level": "INFO", "file": { "path": "applicationinsights.log", "maxSizeMb": 5, "maxHistory": 1 } }, -
To change the log level for the metrics that are captured, modify the instrumentation log level (to start off, leave as is then modify as you get used to the logging)
"instrumentation": { "logging": { "level": "INFO" } }, -
Leave sampling as is to start off with and adjust as required later
"sampling": { "percentage": 100 }, -
Add in some basic JMX Metrics (see this page for a full list)
"jmxMetrics": [ { "name": "Boomi GC Old Gen Collection Count", "objectName": "java.lang:type=GarbageCollector,name=G1 Old Generation", "attribute": "CollectionCount" }, { "name": "Boomi GC Young Gen Collection Count", "objectName": "java.lang:type=GarbageCollector,name=G1 Young Generation", "attribute": "CollectionCount" }, -
Copy the file to the runtime installation directory

Step 3: Test it out
Now restart your runtime, and that’s literally all that’s required to start seeing metrics appearing in Azure! Obviously there’ll be some hiccups in actually getting things working properly. The best place to troubleshoot this is to the logs files on the runtime. Start with the applicationinsights.log as that is usually the log file that will help you troubleshoot. You can also check the container logs to see if there’s any issues loading Application Insights.
Transaction Search
To test if data is appearing, a good place to start is the Transaction Search; this will show you all requests, dependencies (outbound calls), errors, and traces (container.log lines). The traces are particularly useful, see below.

Image 4: Transaction Search Example
Traces
As mentioned above, App Insights will capture all lines that are written to the container logs. This is particularly useful, as that means you can sink custom log message using the notify shape to app insights, and they will immediately appear in Azure! This is somewhat advanced, but in a nutshell you need to do two things:
1. Generate and sink log messages using the notify shape.
a. This should follow a clear format, e.g. processId:UID~processName:PROCESSNAME~executionId:UID
2. Use telemetry preprocessors to capture these logs:
a. In your applicationinsights config, add the following under the preview node:
"processors": [
    {
        "type": "log",
        "body": {
            "toAttributes": {
                "rules": [
                    "(?s): processId:(?<processId>.*?)~processName:(?<processName>.*?)~executionId:(?<executionId>.*?)"
                ]
            }
        }
    }
]
3. Restart the runtime and start pumping some messages through the notify shape.
- You can use the Transaction Search (filter on Traces) to view these and then use KQL to make use of these messages. Try adding start time/end time to your logs, or bespoke information that would be useful.
Caveats:
-
There is an 8000 character limit on what can be logged, so be sure to not exceed this.
-
Although the processors config is under preview, it is actually supported in production; it’s just not backwards compatible with previous versions.
In Summary
Above we’ve talked about the need for observability and the various options that can provide this. We’ve specifically delved into how to implement a Boomi observability solution using Azure Application Insights. These steps are mostly on the Boomi runtime side, involving uploading the required jar file and creating the config file.
So hopefully this shows you what you can achieve when combining Boomi with Application Insights, as well as a rough guide on how to get there. It’s actually not too many steps to get it working, but as with most solutions like this there will be some troubleshooting required to get things working. Once you have it working, there’s so much that can be done with the data in Azure, so have fun!


